
Reviewed · how we check firm rules
Tool · reviewed October 2026
The prop firm calculator: every formula an evaluation needs
Five calculations decide whether a prop firm evaluation is passable and how long it will take: position size from the drawdown, position size from the daily limit, required trade count from the target, remaining room on a trailing account, and the payout ratio from a consistency rule. The calculator below runs all of them on your own numbers; the rest of the page sets out each formula, the inputs it needs, worked examples, and the order in which to apply them.
Run the numbers on your account
The fields start at a $100,000 two-step evaluation. Change any input and every figure below updates as you type. Nothing is submitted and nothing leaves the page: the arithmetic runs in your browser.
What the rulebook implies
- Profit target in cash
- —
- Maximum loss in cash
- —
- Daily loss budget
- —
- Risk per trade
- —
- Losing trades the day absorbs
- —
- Consecutive losses to the maximum
- —
- Average profit per trade
- —
- Trades needed to reach target
- —
- Breakeven win rate at this reward
- —
- Payout on reaching the target
- —
- Largest single day allowed
- —
- Minimum profitable days
- —
—
Trailing drawdown room
On a trailing account the loss threshold follows the peak, so the room left is smaller than the headline drawdown whenever the balance is not at a new high. This panel uses the same arithmetic as the worked example below.
- Loss threshold in cash
- —
- Threshold level
- —
- Room left from here
- —
- Level the threshold stops at
- —
—
The calculator models the arithmetic the rulebook describes; it cannot know whether your firm measures the daily limit on equity or on closed balance, whether the trailing threshold updates intraday or at the close, or whether a breach is defined at the level or beyond it. Each of those changes the answer slightly, and each is stated in the firm's own terms.
Key takeaways
- Position size is the smaller of two derivations: one from the maximum loss, one from the daily limit.
- The target never sets the size; it sets the calendar, through expected value per trade.
- On a trailing account, remaining room equals the drawdown minus the give-back from the peak — not the headline number.
- A consistency rule converts into a daily profit cap, which is the only way to satisfy it automatically.
- Every formula here is arithmetic on numbers your firm publishes; none of it requires a spreadsheet.
Contents
- The order of operations
- The inputs every calculation needs
- Calculation one: position size
- Calculation two: the session budget
- Calculation three: the calendar
- Calculation four: remaining room on a trailing account
- Calculation five: the consistency cap
- A full worked evaluation
- Units, rounding and the errors they cause
- Where each number comes from in a firm's terms
- Monthly review: keeping the numbers true
- Frequently asked questions
The order of operations
Most evaluation failures are not caused by bad arithmetic. They are caused by doing the arithmetic in the wrong order — sizing from the target, then discovering the daily limit was the real constraint, then adjusting in the middle of an attempt.
The correct order runs from the constraint inward. The maximum loss fixes the size. The daily limit may reduce it further. The target plays no part in the size at all; it determines how many trades the plan needs, and therefore how long the attempt takes. The trailing mechanism determines whether the size is still valid next week. The consistency rule determines how much profit can be taken in a single day once the target is met.
Applied in that order, the numbers are consistent by construction: the size fits the room, the session budget fits the day, and the calendar is a consequence rather than a hope. Applied in any other order, the plan contains a contradiction that shows up under pressure, usually in the final third of an attempt when the contradiction is most expensive.
Five calculations follow, each with one input list and one output. They can be done on paper in about ten minutes and should be redone weekly, because two of the inputs — the remaining room and, on a trailing account, the size itself — change as the account progresses.
The inputs every calculation needs
Six numbers, all of them published by the firm or measurable on the platform. Collect them before calculating anything; a plan built on estimated inputs is a plan with an unknown error term.
| Input | Where it comes from | Why it matters |
|---|---|---|
| Maximum loss | Evaluation terms | Sets the failure floor and the first size derivation |
| Daily limit | Evaluation terms | Sets the session budget and usually the binding size constraint |
| Profit target | Evaluation terms | Sets the calendar, never the size |
| Instrument value | Contract specification or pip value | Converts a stop distance into money |
| Stop distance | The strategy, in ticks or pips | Fixed by the setup, not by the account |
| Measured expectation | Your own trade records | Converts the target into a trade count and a calendar |
Two of those inputs are frequently guessed and should not be. The stop distance is a property of the strategy and the timeframe; if it changes with the account size, the strategy is not being traded as designed. The expectation per trade is the output of a sample of the trader's own trades, including costs — and it is the single input most often replaced by optimism.
Where an input is unknown — for example, the exact reference point of a daily limit, or whether a floor samples equity or balance — use the harsher reading. The only cost of an over-conservative assumption is a slower calendar; the cost of an over-optimistic one is a breached account.
Calculation one: position size
Inputs: maximum loss, streak tolerance, instrument value, stop distance.
Output: the maximum position size in lots or contracts.
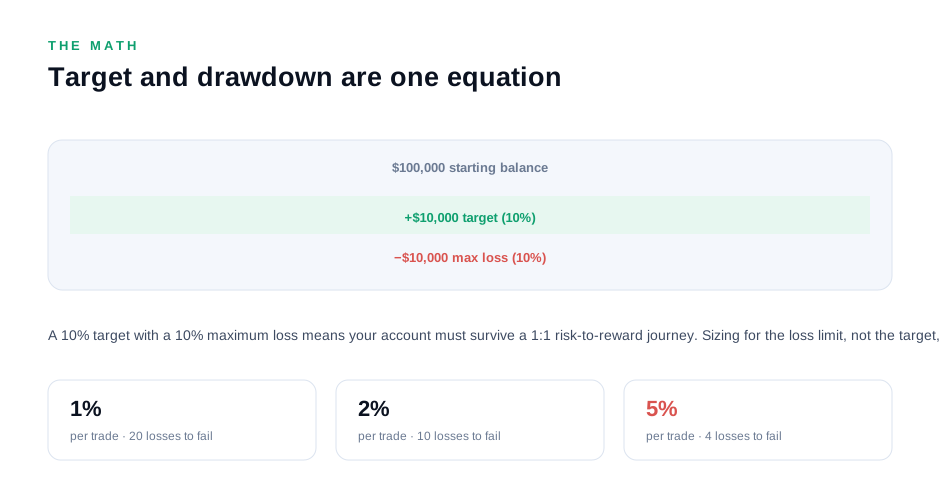
The formula has two steps. First, the money risked per trade: maximum loss divided by the number of consecutive losses the plan should survive. Eight to ten is a reasonable design case for a discretionary plan with a win rate in the forties, because runs of that length recur within a few hundred trades. Second, the size: money per trade divided by the stop distance multiplied by the value per unit of distance.
Worked example. A 10% maximum loss on a $100,000 account is $10,000. At a streak tolerance of ten, risk per trade is $1,000. If the instrument is worth $10 per tick and the strategy's stop is 40 ticks, the cost of the stop at one contract is $400, so the maximum size is $1,000 ÷ $400 = 2.5 contracts, rounded down to two. Rounding up to three would put risk per trade at $1,200 — 20% above the plan.
For a forex account the same formula uses pip value and lot size: money per trade divided by the stop in pips, divided by the value of one pip per lot. The result is lots, rounded down to the platform's minimum increment.
Three refinements worth building into the calculation. Deduct the expected cost per round turn — spread plus commission — from the money per trade before dividing, because on a small account the cost can be a fifth of the risk. Keep a quarter of the maximum loss in reserve, which means using 75% of the derived size rather than 100%. And cap the result at the firm's lot or contract limit, which is a ceiling the formula can exceed on a large account or a tight stop.
Calculation two: the session budget
Inputs: daily limit, the money risk per trade from calculation one.
Output: the maximum number of losing trades a session can absorb.
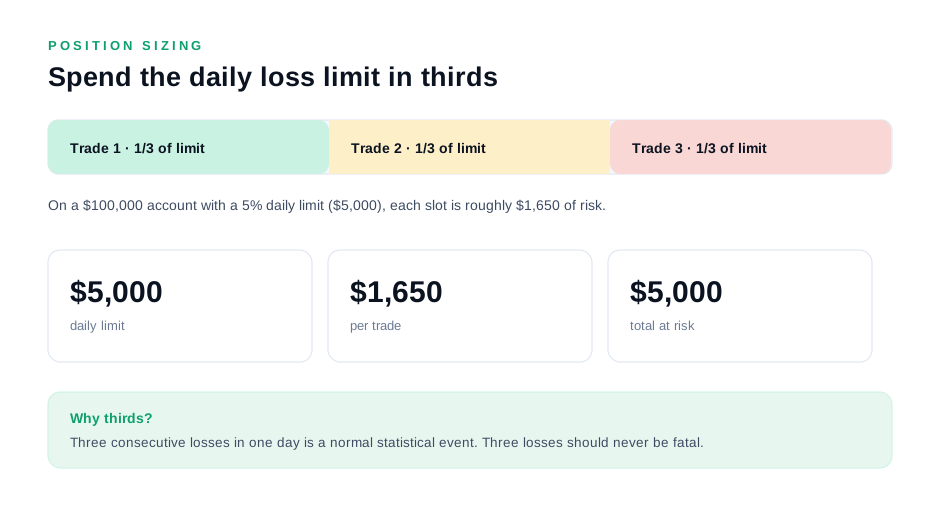
The formula is the daily limit divided by the money risk per trade. The result is the session's capacity for losses, and it is the number that decides whether the plan is executable as designed.
Worked example. A 5% daily limit on a $100,000 account is $5,000. At $1,000 risked per trade, a session absorbs five consecutive losses. That is workable: the plan can take a bad start and keep trading. At $2,500 per trade it absorbs two, which means the third loss closes the platform and the session was decided by the first two trades of the day.
The useful rule of thumb is a design target of four to six losses of capacity. Below four, the daily limit is doing the job the maximum loss should be doing, and the plan will spend a significant number of sessions on the sideline. Above six, risk per trade is so small relative to the day that the calendar stretches and recurring platform and data costs start to dominate the economics.
The second half of the calculation is the trade cap. It should be set below the capacity for losses, because not every bad session is composed of clean stop-outs: a trade can lose more than planned through slippage, and an early stop-out followed by re-entry is still two positions. A cap of roughly two-thirds of the calculated capacity is a reasonable convention.
Two inputs change the answer and are easy to miss. If the daily limit is measured on equity rather than balance, open positions consume the budget continuously, so the effective capacity is lower than the division suggests. And if the firm's day boundary falls in the middle of the trading session, the capacity has to be divided across two server days rather than treated as one budget.
Calculation three: the calendar
Inputs: target, money risk per trade, reward-to-risk ratio, win rate, trades per week.
Output: the number of trades and the calendar.
Expected value per trade is the win rate multiplied by the average win, minus the loss rate multiplied by the average loss. With risk per trade fixed, the average loss is known and the average win follows from the ratio. Divide the target by the expectation per trade to get the trade count; divide by trades per week to get the calendar in weeks.
Worked example. Risk per trade $1,000, ratio 1:2, so average win $2,000 and average loss $1,000. At a 45% win rate, expectation is 0.45 × 2,000 − 0.55 × 1,000 = $350 per trade. On a $100,000 account with an 8% target, that is $8,000 ÷ $350 = 23 trades at expectation. At two trades per session and five sessions a week, the calendar is about two and a half weeks.
The same calculation run at a different size illustrates the point of the whole page. Doubling the risk per trade doubles the expectation in dollars but also halves the streak tolerance, so the trade count falls to twelve and the breach probability rises by more than the calendar improves. The faster plan is not merely riskier; it is riskier in exchange for a smaller benefit than it appears.
Three legitimate ways to shorten the calendar, in order of preference: raise the reward-to-risk ratio by improving exits, raise the win rate by becoming more selective, or add sessions within the daily limit. Each changes the plan's quality. Increasing size changes only the distribution around it.
Where the calendar produced by this calculation exceeds the firm's deadline, the conclusion is arithmetic rather than motivational: the plan cannot pass that evaluation at a survivable size. The correct responses are a smaller account with the same percentages, a different rulebook, or a slower target — not more risk.
Calculation four: remaining room on a trailing account
Inputs: peak equity reached, current equity, maximum loss.
Output: the room available now, in money.
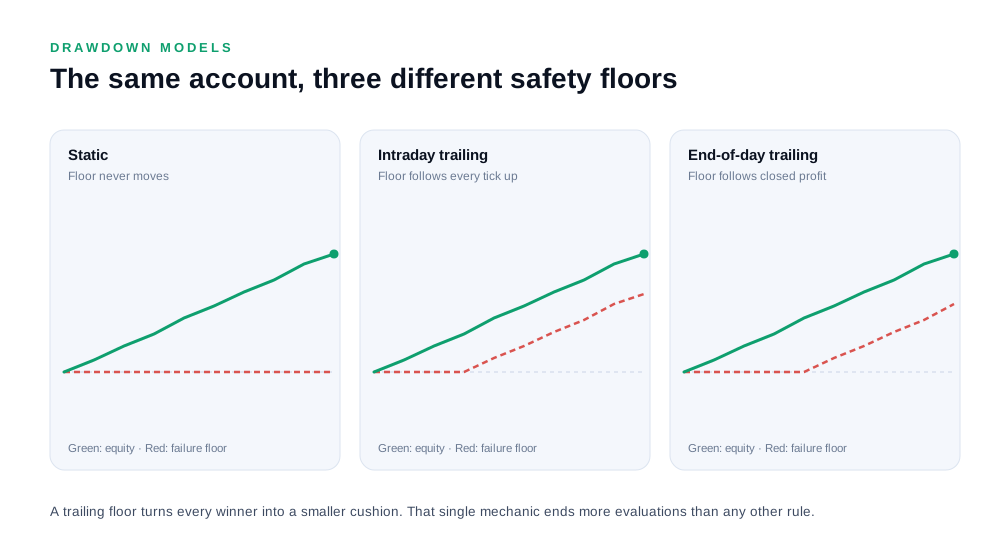
Remaining room equals the maximum loss minus the amount the account has given back from its peak. Expressed in levels: floor equals peak minus maximum loss; room equals current equity minus floor.
Worked example. Start $100,000, maximum loss $10,000, so the floor starts at $90,000 and the room is $10,000. The account reaches a peak of $104,000, which lifts the floor to $94,000. Equity then falls to $101,000. The room is $101,000 − $94,000 = $7,000, not the $10,000 the terms advertise and not the $11,000 of profit above the starting balance. The account is up $1,000 and its room has fallen by 30%.
The same calculation feeds the size derivation. With $7,000 of room and a streak tolerance of ten, risk per trade is $700, not $1,000 — a 30% reduction in size, which is exactly the adjustment most traders skip. That omission is the single most common cause of a breach in the final third of a trailing-drawdown evaluation.
Two variants change the formula. On a static account the peak is irrelevant and the room is always the maximum loss. On an end-of-day trailing account the peak is the highest closing balance rather than the highest intraday equity, which is a meaningfully more forgiving number. Establish which applies before relying on the result — the trailing drawdown guide covers the variants and the lock-in clauses that stop the floor moving.
Calculation five: the consistency cap
Inputs: the consistency ratio, the payout threshold.
Output: the maximum profit to take in one day.
If the best day may be no more than a stated share of total profit, then the cap on a single day is that share multiplied by the profit at the point of withdrawal. A ratio of one-third with a $6,000 threshold allows a best day of $2,000; a ratio of one-fifth allows $1,200.
The reverse calculation is the one that matters mid-attempt: given the largest day already recorded, what total profit is required before a full withdrawal is permitted? The answer is the largest day divided by the ratio. A $1,500 best day under a one-third rule requires $4,500 of total profit. Under a one-fifth rule it requires $7,500 — the same trading record, a materially longer road to a payout.
Worked example. A plan with an 8% target on $100,000 produces $8,000 of profit. Under a one-third rule, a single day of up to $2,666 is permitted inside that record; under a one-fifth rule, $1,600. A trader whose average winning day is $400 is comfortably inside both. A trader whose best day is $3,000 has already broken the one-third rule inside an otherwise successful evaluation, and the consequence lands at the payout request rather than at the pass.
The practical output of this calculation is a daily profit cap: set it below the permitted share, and the ratio is satisfied automatically by the time the threshold is reached. The consistency guide covers the common ratio variants and how each is applied at payout.
A full worked evaluation
All five calculations applied to one account, in order. The figures are illustrative; the sequence is the part to copy.
The account. $100,000, two-phase evaluation, 8% target per phase, 10% maximum loss measured from the starting balance, 5% daily limit, consistency rule of one-third applied at payout.
Step one, size. $10,000 maximum loss ÷ 10 = $1,000 per trade. Reserve-adjusted to 75%, $750. On an instrument worth $10 per tick with a 30-tick stop, the cost per contract is $300, so the maximum size is two contracts ($600 risked, comfortably inside $750). Three contracts would be $900, above the reserve line.
Step two, session budget. $5,000 daily limit ÷ $600 actual risk = eight losses of capacity. With a trade cap of five, the session is well inside the limit, and a normal losing run cannot close the day.
Step three, calendar. At a 1:2 ratio, an average win is $1,200 and an average loss $600. At a 45% win rate the expectation is 0.45 × 1,200 − 0.55 × 600 = $210 per trade. The $8,000 target therefore needs 38 trades at expectation: at three trades a session across five sessions a week, about twelve sessions — two and a half weeks — for phase one, and the same again for phase two.
Step four, trailing check. There is no trailing floor on this account, so the room is a constant $10,000 and the size derived in step one holds for the whole attempt. If the floor trailed, this step would have to be rerun every Monday and after any strong session.
Step five, consistency. A one-third rule against an $8,000 profit permits a best day of $2,666. A daily profit cap of $1,500 keeps the ratio intact with margin, and at an average winning day of $1,200 it costs very little pace.
The gates. At 25% of target, compare realised with planned cost per trade. At 50%, compare the calendar against the trade count. At 75%, confirm the daily limit has not been touched more than once. At 90%, halve the size, hold the profit cap, and accept the extra sessions.
Nothing in that sequence required a spreadsheet, and every number came from the firm's terms or from the trader's own records. That is the point of writing the formulas down: it converts a rulebook into a plan, and a plan is the only thing that can be followed under pressure. The profit target guide covers the levers this arithmetic exposes, and the recovery guide covers what to do when a plan produced by it still fails.
Units, rounding and the errors they cause
Four unit errors account for most of the gap between a calculated plan and a plan that behaves as calculated.
Rounding up. Position size must always round down, because rounding up increases risk above the derivation. On a contract-based account the nearest whole contract may be a large jump; on a forex account the difference between 0.4 and 0.5 lots is 25% of the risk budget.
Mixing tick and point values. A contract specification quotes a value per tick and the platform may quote points. Where a point is a multiple of a tick, using the wrong one changes the size by that multiple. The safe method is to express the stop in the same unit the value is quoted in, and to verify the result against the platform's own profit calculator for a single contract.
Percentage against balance or equity. A daily limit described as a percentage of equity changes as open positions move; one described against balance does not. For the session budget calculation, use the harsher interpretation — equity — because that is what the firm's server is most likely measuring continuously.
Currency of the account. A target expressed in dollars on an account denominated in another currency, or a profit denominated in the instrument's currency, needs converting at the rate the firm applies — which may be the platform's current rate rather than the rate on the day of the trade. Where the account currency differs from the instrument's, apply a small haircut to the derived size rather than assuming the conversion is neutral.
The remedy for all four is a verification step. Before the first real trade of an evaluation, open a single minimum-size position and check that the platform's own risk figure matches the calculation. One trade's worth of verification removes a class of error that would otherwise compound across the attempt.
Where each number comes from in a firm's terms
Every input has a home in the firm's documentation, and knowing where to look turns a fifteen-minute read into a three-minute one.
| Number | Document | Watch for |
|---|---|---|
| Maximum loss | Evaluation terms | Static, end-of-day trailing or intraday trailing; balance or equity |
| Daily limit | Evaluation terms | Reference point and the server day boundary |
| Profit target | Evaluation terms | Per stage, and whether it must be reached without breaching a day rule |
| Minimum days | Evaluation terms | Whether the count is per stage or cumulative |
| Consistency rule | Funded terms, sometimes both | Applied once at first payout or at every withdrawal |
| Payout threshold | Funded terms | Whether profit above the threshold can be withdrawn in full |
| Contract or lot cap | Evaluation terms | Per position, per account, or both |
The rules matrix collects these fields across firms, and the 2026 comparison covers the wider market. Both are useful for shortlisting; neither replaces the firm's current terms, which are the only document that governs the account.
Where a number cannot be found, the fastest route is a support ticket asking one specific question. Firms revise terms, and a written answer is both an input to the calculation and evidence of the version in force when the account was bought.
Monthly review: keeping the numbers true
Two of the five calculations change over time even when the terms do not. On a trailing account the room shrinks with any give-back from a peak, and the size derived from it must follow. And expectation per trade is only knowable from records, which accumulate.
A weekly review covers four numbers and takes about ten minutes: trades taken, expectation per trade, worst drawdown so far, distance to target. A monthly review reruns calculations one, two and four from the current state of the account, and answers one question — is the plan still passable at the size it is currently being traded?
If the answer is no, the correction is size down and calendar up. That feels like failure in the moment and is, in fact, the arithmetic working as intended: the whole purpose of the calculations is to discover the problem on paper rather than in a breached account. A plan that is reviewed weekly rarely fails on the day nobody was looking.
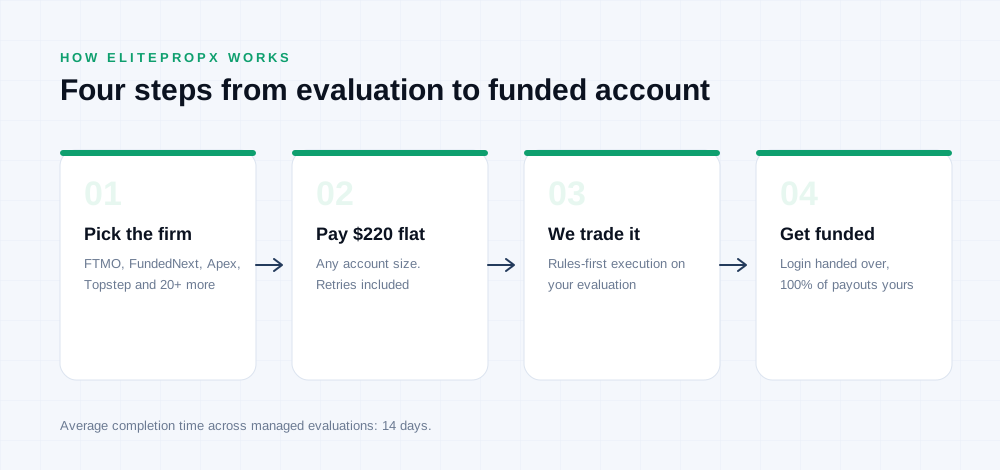
Where the evaluation is being traded on the trader's behalf, the same five calculations form the specification. ElitePropX charges a flat $220 per evaluation at any stage and size, covers retries, takes no profit split, and works with any firm, telling you in writing what that firm’s third-party trading clause says before you pay. The passing services guide covers what to require from any provider, and the FAQ answers the questions that come up most often.
Two mistakes the arithmetic exposes
Two errors account for most of the gap between a plan that works on paper and one that behaves as calculated, and both are visible in the formulas rather than in the trading.
Mistake one: computing size from the target. It is the single most common error in evaluation preparation, and it appears whenever a trader divides the target by the number of trades they intend to take. The output looks like a risk plan and is actually a schedule with the risk left unspecified. The correct derivation never mentions the target: size comes from the floor and the session budget, and the target is used afterwards to check whether the resulting calendar fits.
Mistake two: treating the derived size as permanent. On a static account it is permanent, which is why the error goes unnoticed for years. On a trailing account it is valid only until the floor moves, which can happen within a session. The correction is a weekly recomputation and, after any strong session, an immediate one. The formula is the same in both cases; only the input has changed.
There is a third error worth naming because it is an error of omission rather than arithmetic: failing to convert the terms into a specification. A trader who has read the drawdown clause but never written down the resulting contract count has the information and not the plan. The five calculations exist to force that conversion, and the output should sit on one page next to the platform — four numbers and a calendar, updated weekly.
Frequently asked questions
What is the formula for position size on a prop firm account?
Maximum loss divided by the number of consecutive losses the plan must survive gives the money risked per trade. Divide that by the stop distance multiplied by the value per unit of distance to get lots or contracts. Then check it against the daily limit and round down.
Should I size from the profit target or the drawdown?
From the drawdown and the daily limit — never from the target. The target determines how many trades the plan needs and therefore the calendar. Sizing from the target is how a plan that is passable on paper becomes one that breaches in practice.
How many consecutive losses should my plan survive?
Eight to ten for a discretionary plan with a win rate in the forties, because runs of that length recur within a few hundred trades. A higher tolerance means a smaller size and a longer calendar, which is the correct trade-off after a failure.
How do I calculate the calendar for an evaluation?
Expectation per trade equals win rate times average win minus loss rate times average loss. Divide the target by that figure for the trade count, then divide by trades per week. A conservative plan usually lands between twenty and forty trades.
How do I calculate remaining room on a trailing account?
Remaining room equals the maximum loss minus the give-back from the peak. In levels: floor is peak minus maximum loss, and room is current equity minus floor. It is smaller than the advertised drawdown whenever the account is not at a new peak.
Why did my position size need to shrink after a profitable week?
Because on a trailing account the floor rose behind the profit. If the account peaked and then gave part of it back, the room is smaller than it was before the run, even though the balance is higher. Recompute the size from the current room.
How do I convert a consistency rule into a daily cap?
Multiply the ratio by the payout threshold. A one-third rule with a $6,000 threshold permits a best day of $2,000, so cap daily profit below that. Set the cap from day one and the ratio is satisfied automatically when the threshold is reached.
What is a workable daily trade cap?
About two-thirds of the number of losses the daily limit can absorb. If the limit permits eight losses at the plan's risk, cap the session at five trades. The margin covers slippage, re-entries and the fact that not every loss is a clean stop-out.
Why does rounding position size down matter so much?
Because rounding up raises risk above the derivation. One extra contract on a large index future can double the risk of a position, and 0.5 rather than 0.4 lots is 25% more risk than the plan specified. Always round down; if the result is zero, use a smaller contract size.
What if the required calendar is longer than the firm's deadline?
Then the evaluation is not passable at a survivable size, and that is an arithmetic conclusion rather than a motivational one. Options: a smaller account with the same percentage rules, a different rulebook model, or a longer target — not more risk per trade.
How often should I rerun these calculations?
Weekly, using four numbers: trades taken, expectation per trade, worst drawdown and distance to target. On a trailing account, rerun the room and size calculations after any strong session as well, because the floor may have moved.
Do I need a spreadsheet?
No. All five calculations are two or three divisions each, and the output is four numbers that fit on a card: risk per trade, trade cap, daily profit cap and the calendar. The calculator above does them in the right order, which is the part worth getting right; a spreadsheet adds nothing except the temptation to model scenarios instead of following one.
Where do I find each input in my firm's terms?
Maximum loss, daily limit, target and minimum days come from the evaluation terms; the consistency rule and payout threshold usually live in the funded terms. Where a number is missing or ambiguous, ask support in writing and keep the reply — it is an input and a record.
Embed this calculator on your site
The page is self-contained: no framework, no tracking pixel, no request to a third party, so it behaves the same inside an iframe. Paste the snippet below where the tool should appear and adjust the height. Keeping the credit link is the one condition.
<iframe src="https://elitepropx.com/prop-firm-calculator.html#calculator" title="Prop firm calculator" width="100%" height="1500" loading="lazy" style="border:1px solid #e6eaf2;border-radius:12px"></iframe>
<p>Calculator by <a href="https://elitepropx.com/prop-firm-calculator.html">ElitePropX</a></p>
A plain link works as well as an embed. Every figure the calculator produces comes from a formula printed further up this page, which makes them checkable rather than a black box — worth keeping in mind if you quote a number anywhere.
Want the evaluation traded for you?
Related reading
- Profit target strategies that survive the rules
- Trailing drawdown maths
- Daily drawdown explained
- Consistency rule guide
- Leverage explained
- Profit calculator: payout, fee and net result
- Prop firm rules matrix
- Prop firm comparison 2026
- Frequently asked questions
ElitePropX is an independent service and is not affiliated with, endorsed by or sponsored by any proprietary trading firm. These formulas describe mechanics, not advice, and the inputs must be read from your firm's current terms. Trading involves substantial risk of loss.